Fishbone Diagram Excel Template
Get to the Root of the Problem — with the Fishbone Diagram Excel Tool
🎯 Tired of Guessing Why Problems Keep Happening?
When teams treat surface-level symptoms, the real issues persist. Time is wasted. Resources are misused. And the same problem keeps returning — frustrating your team and hurting your performance.
✔ Your Solution: The All-in-One Fishbone Diagram Template
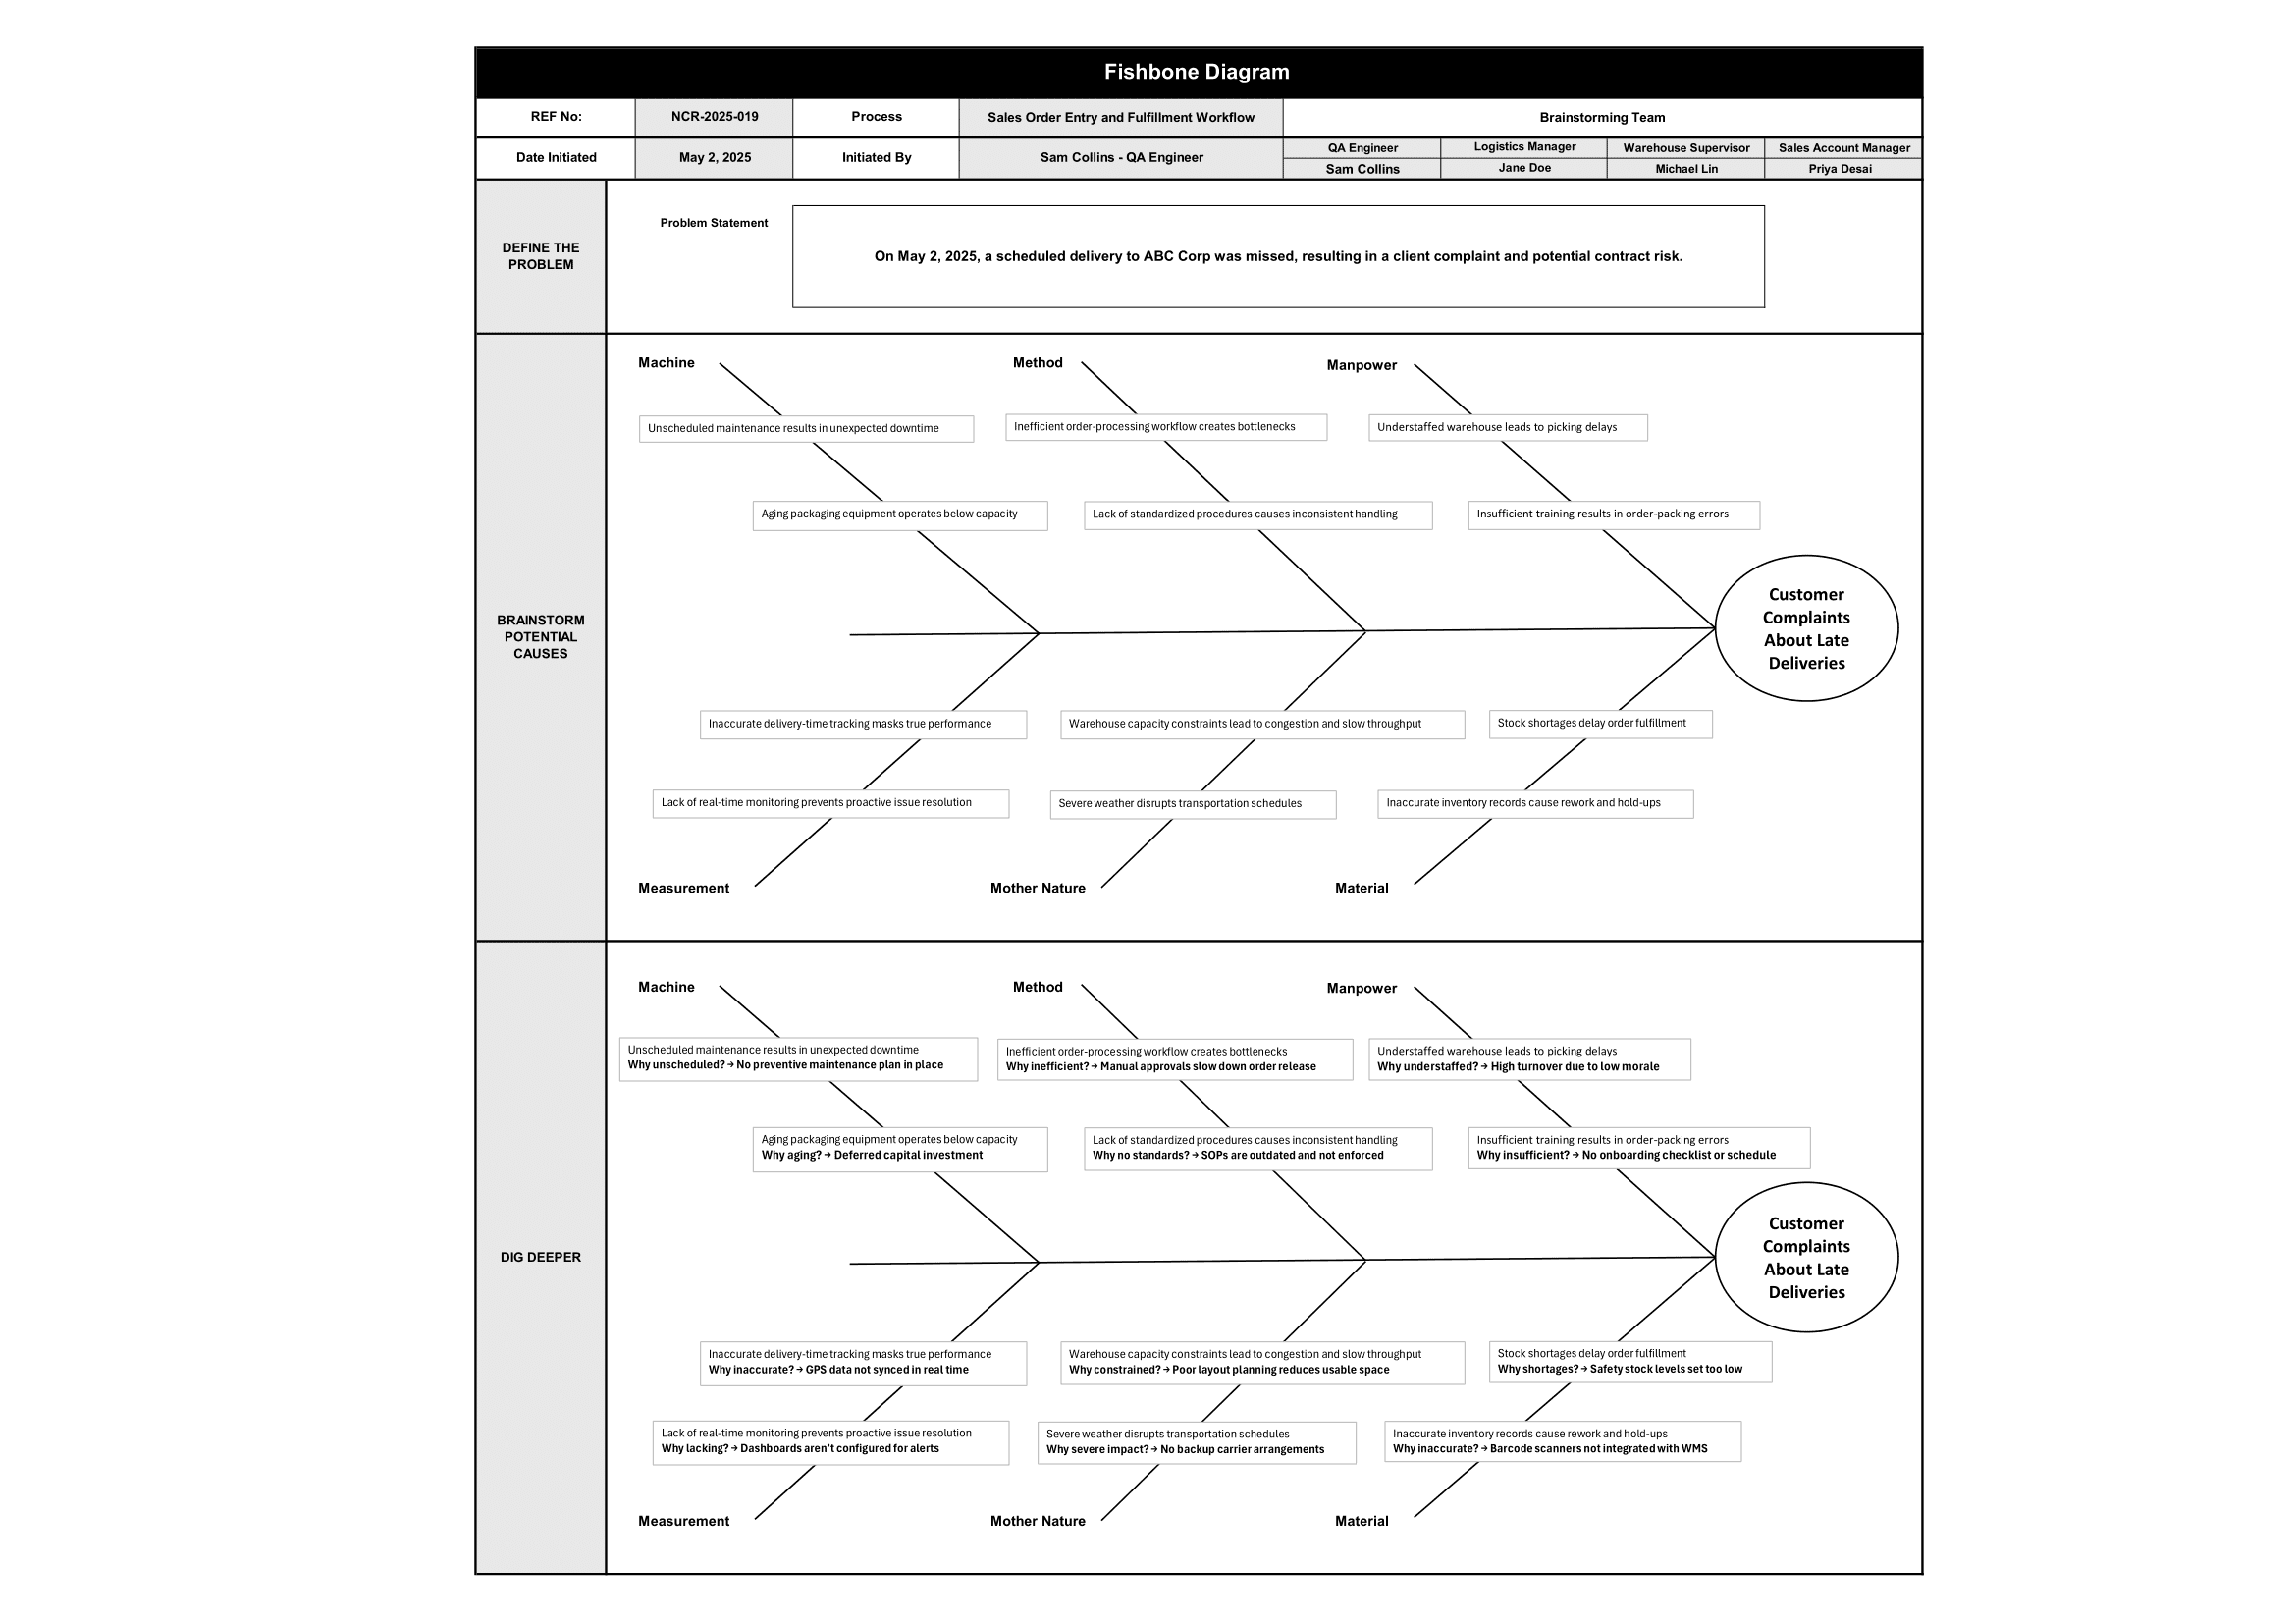
Our ready-to-use 6M Fishbone Diagram (Ishikawa) Tool helps you and your team visually map out the root causes behind any issue — clearly and logically. Whether you're tackling quality issues, process failures, or customer complaints, this Excel-based template helps you break down causes by category and uncover what's really going wrong.
Perfect for root cause analysis, CAPA investigations, Lean Six Sigma, and ISO 9001 compliance.
🔍 What’s Inside the Fishbone Tool?
Designed to simplify root cause analysis while offering flexibility and clarity:
✅ Pre-Built Fishbone Diagram – Clearly structured layout with editable branches
✅ Classic Cause Categories – Includes templates for 6Ms (Man, Machine, Method, Material, Measurement, Environment)
✅ Visual Layout for Presentations – Clean, professional format for reports or audits
✅ Fully Editable – Change categories, fonts, or colors to suit your business or industry
✅ Audit-Ready Format – Clean, logical layout ready for internal reviews or external audits
✅ Industry Example - An industry example demonstrating how the template should be used for maximum clarity.
🌟 Benefits You’ll Notice Immediately
💡 See the Bigger Picture of Every Problem
Identify root causes across multiple dimensions — not just the obvious ones.
💡 Facilitate Productive Team Discussions
Use it in meetings or workshops to generate ideas, uncover gaps, and align solutions.
💡 Support Deeper Investigations
Pairs perfectly with CAPA, 5 Whys, or PFMEA tools for structured problem-solving.
💡 Improve Audit Readiness
Demonstrates a systematic approach to quality issue resolution — key for ISO 9001.
💡 Works for Any Process or Industry
Whether in manufacturing, healthcare, service, or tech — this tool adapts to you.
🧑💼 Who Should Use This Fishbone Tool?
Ideal for:
Quality and compliance managers
Root cause analysis teams
Project and process improvement leads
ISO 9001 or Lean Six Sigma implementers
Internal auditors and consultants
⚙️ How It Works
Download instantly after purchase
Open in Excel or Google Sheets
Enter your problem statement
Brainstorm causes by category and fill in the diagram
🛡 100% Risk-Free
✔ Instant Download
✔ One-Time Payment — No subscriptions
✔ Secure Checkout
✔ Lifetime Access
❓ Frequently Asked Questions
Can I edit the diagram and categories?
Yes — everything is fully editable. You can rename categories, add branches, change visuals, or rebrand it for your organization.
Is this suitable for ISO 9001 or Lean Six Sigma projects?
Absolutely. It’s built for structured problem-solving and is fully compatible with ISO, Lean, and Six Sigma root cause methodologies.
Can I link it to other tools like CAPA or 5 Whys?
Yes — and it works great alongside them. You can use the Fishbone to identify causes, then dive deeper using a 5 Whys or initiate corrective action.

✅ Ready to Uncover the Real Reason Behind Your Issues?
The Fishbone Diagram Excel Tool helps you solve problems at the source — not just patch the symptoms. Whether you’re working through a non-conformance, leading a Lean team, or preparing for an audit, this tool makes structured root cause analysis simple and visual.
Purchase this template inside the QMS Toolkit package available below.